Between 2014 and 2023, there were 2,455 occurrences in Australia reported to the ATSB.
There were 33 accidents with 1 of these being fatal.
| Incident type | CAT | Non-CAT | Total |
|---|---|---|---|
| Accidents | 5 | 28 (1 Fatal) | 33 |
| Serious Incidents | 19 | 107 | 126 |
| Incidents | 1,630 | 666 | 2,296 |
| Total | 1,654 | 801 | 2,455 |
| Incident % | 67% | 33% | 100% |
Source: BITRE, ATSB Occurrence Database
Note: The BITRE data is only available until 2022.
Accidents per million flying hours
We analysed certified non-controlled aerodromes separately.
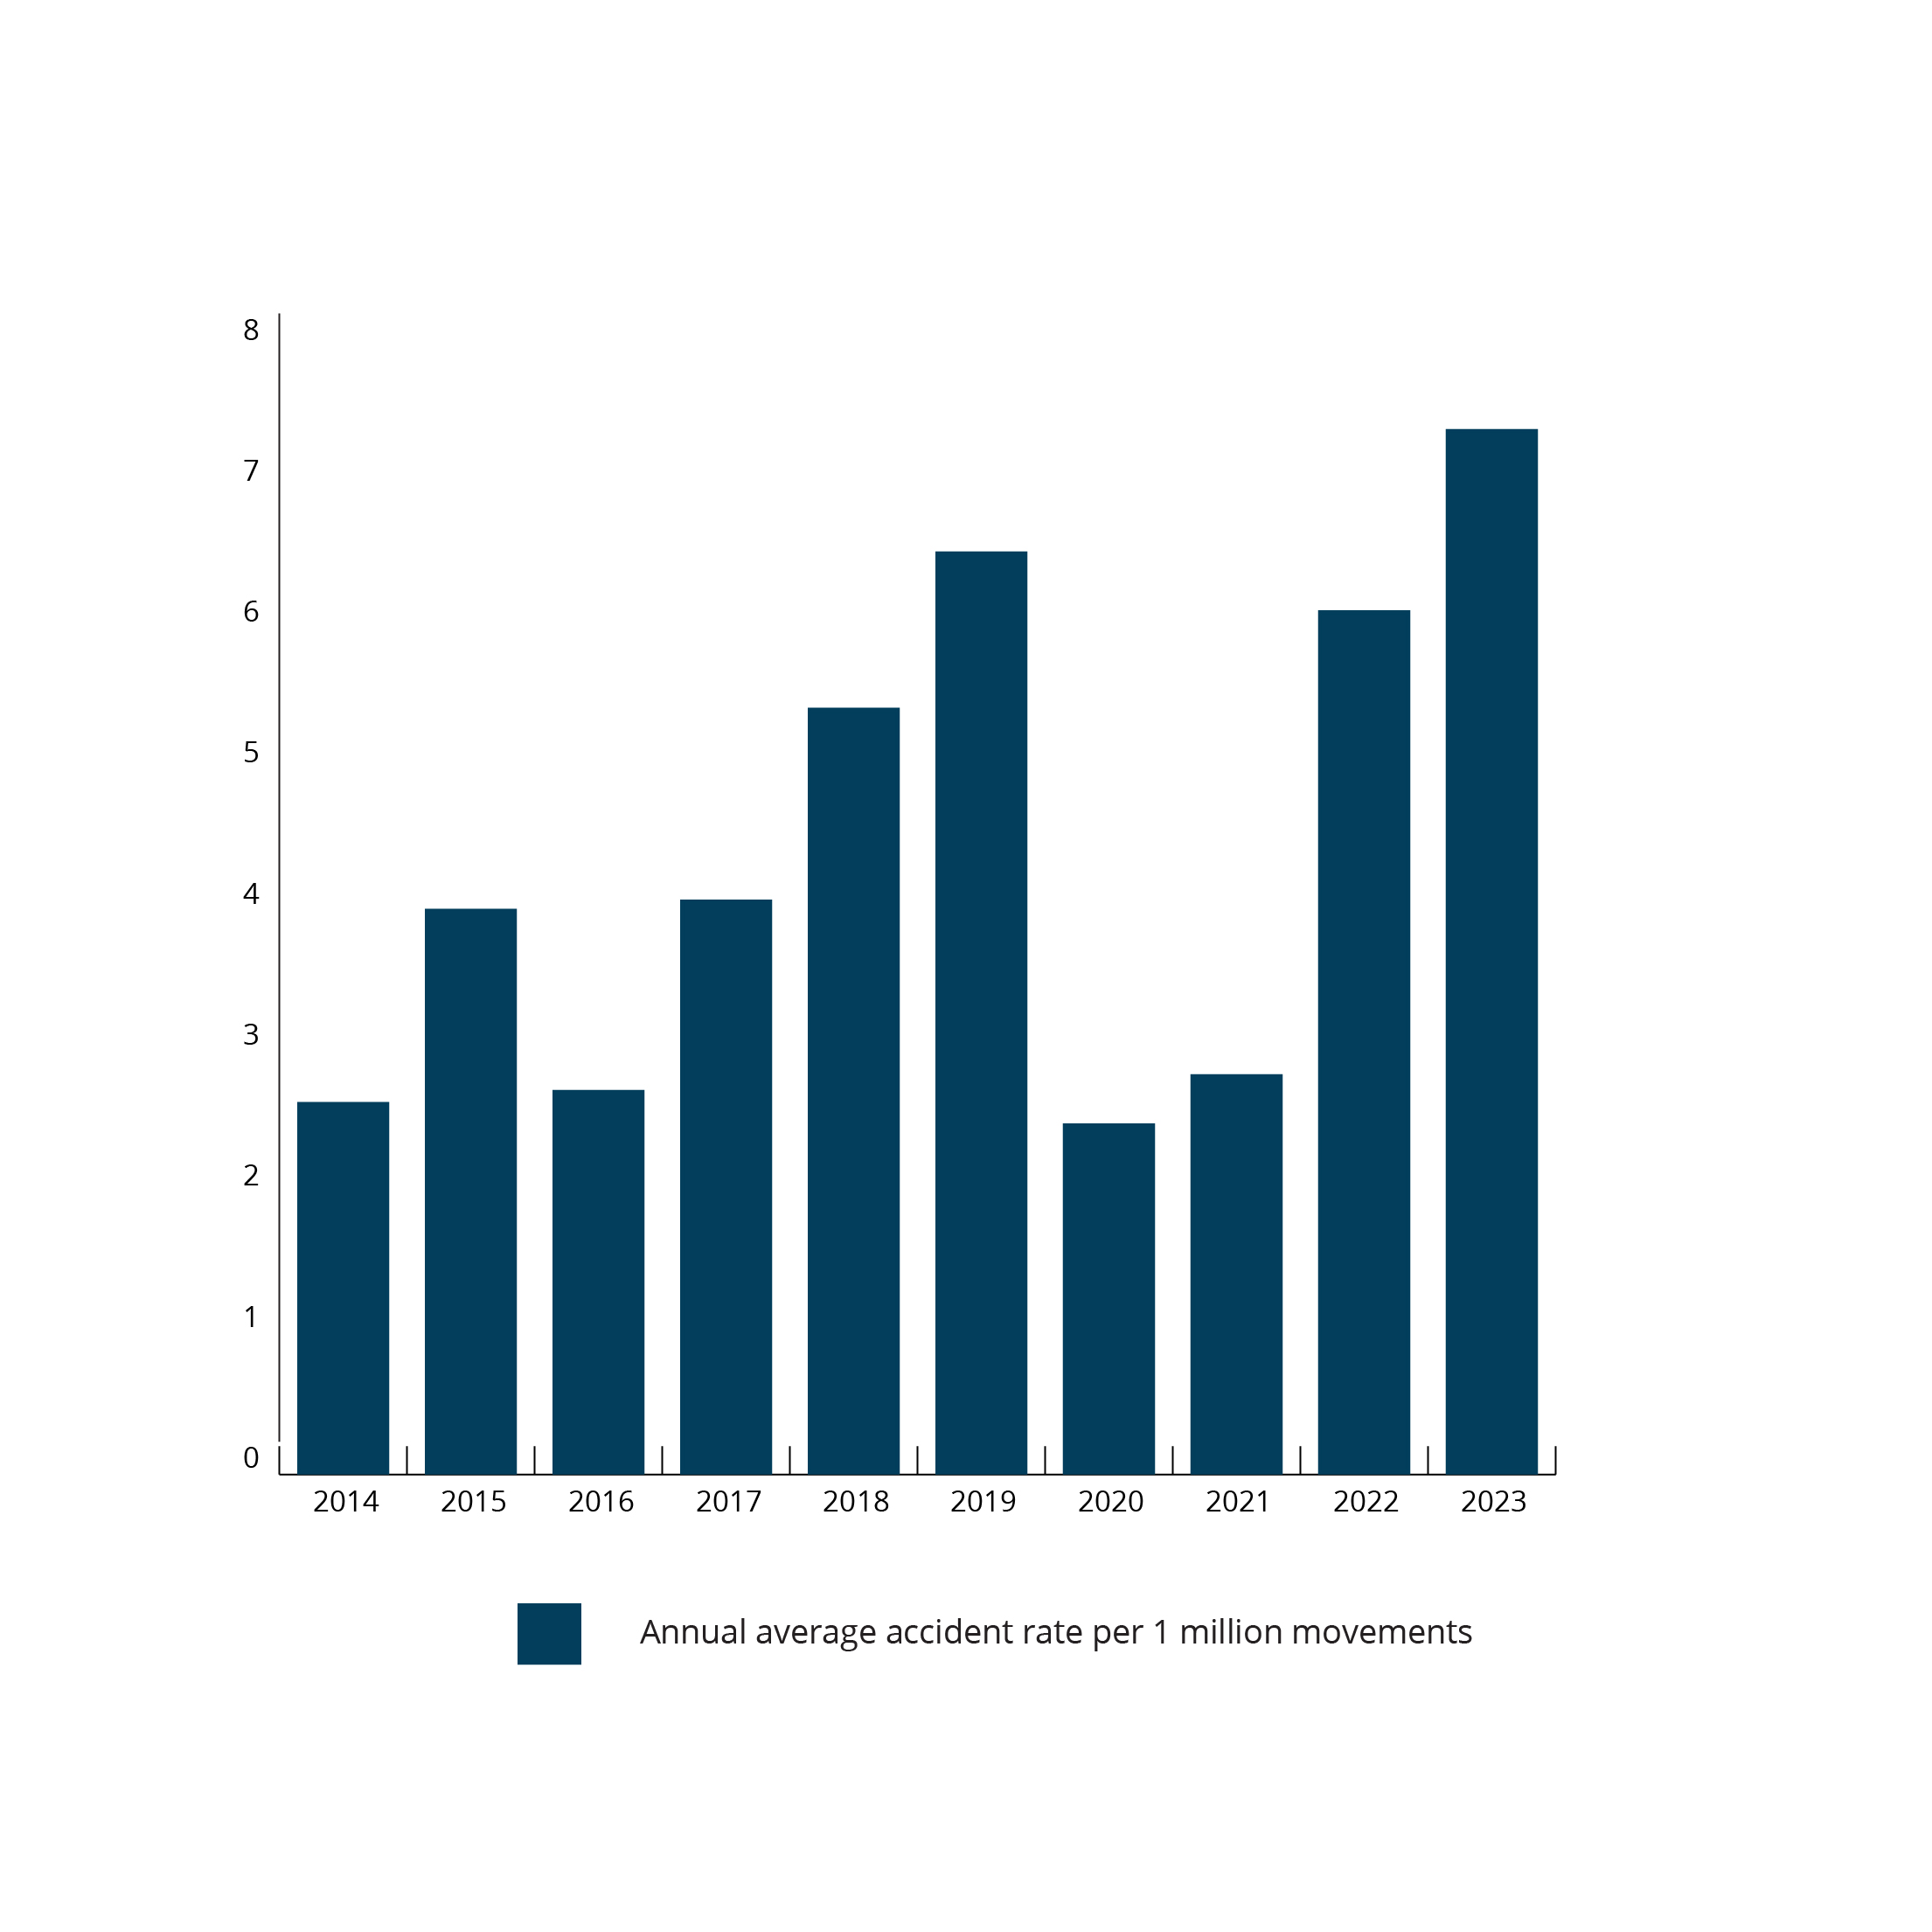
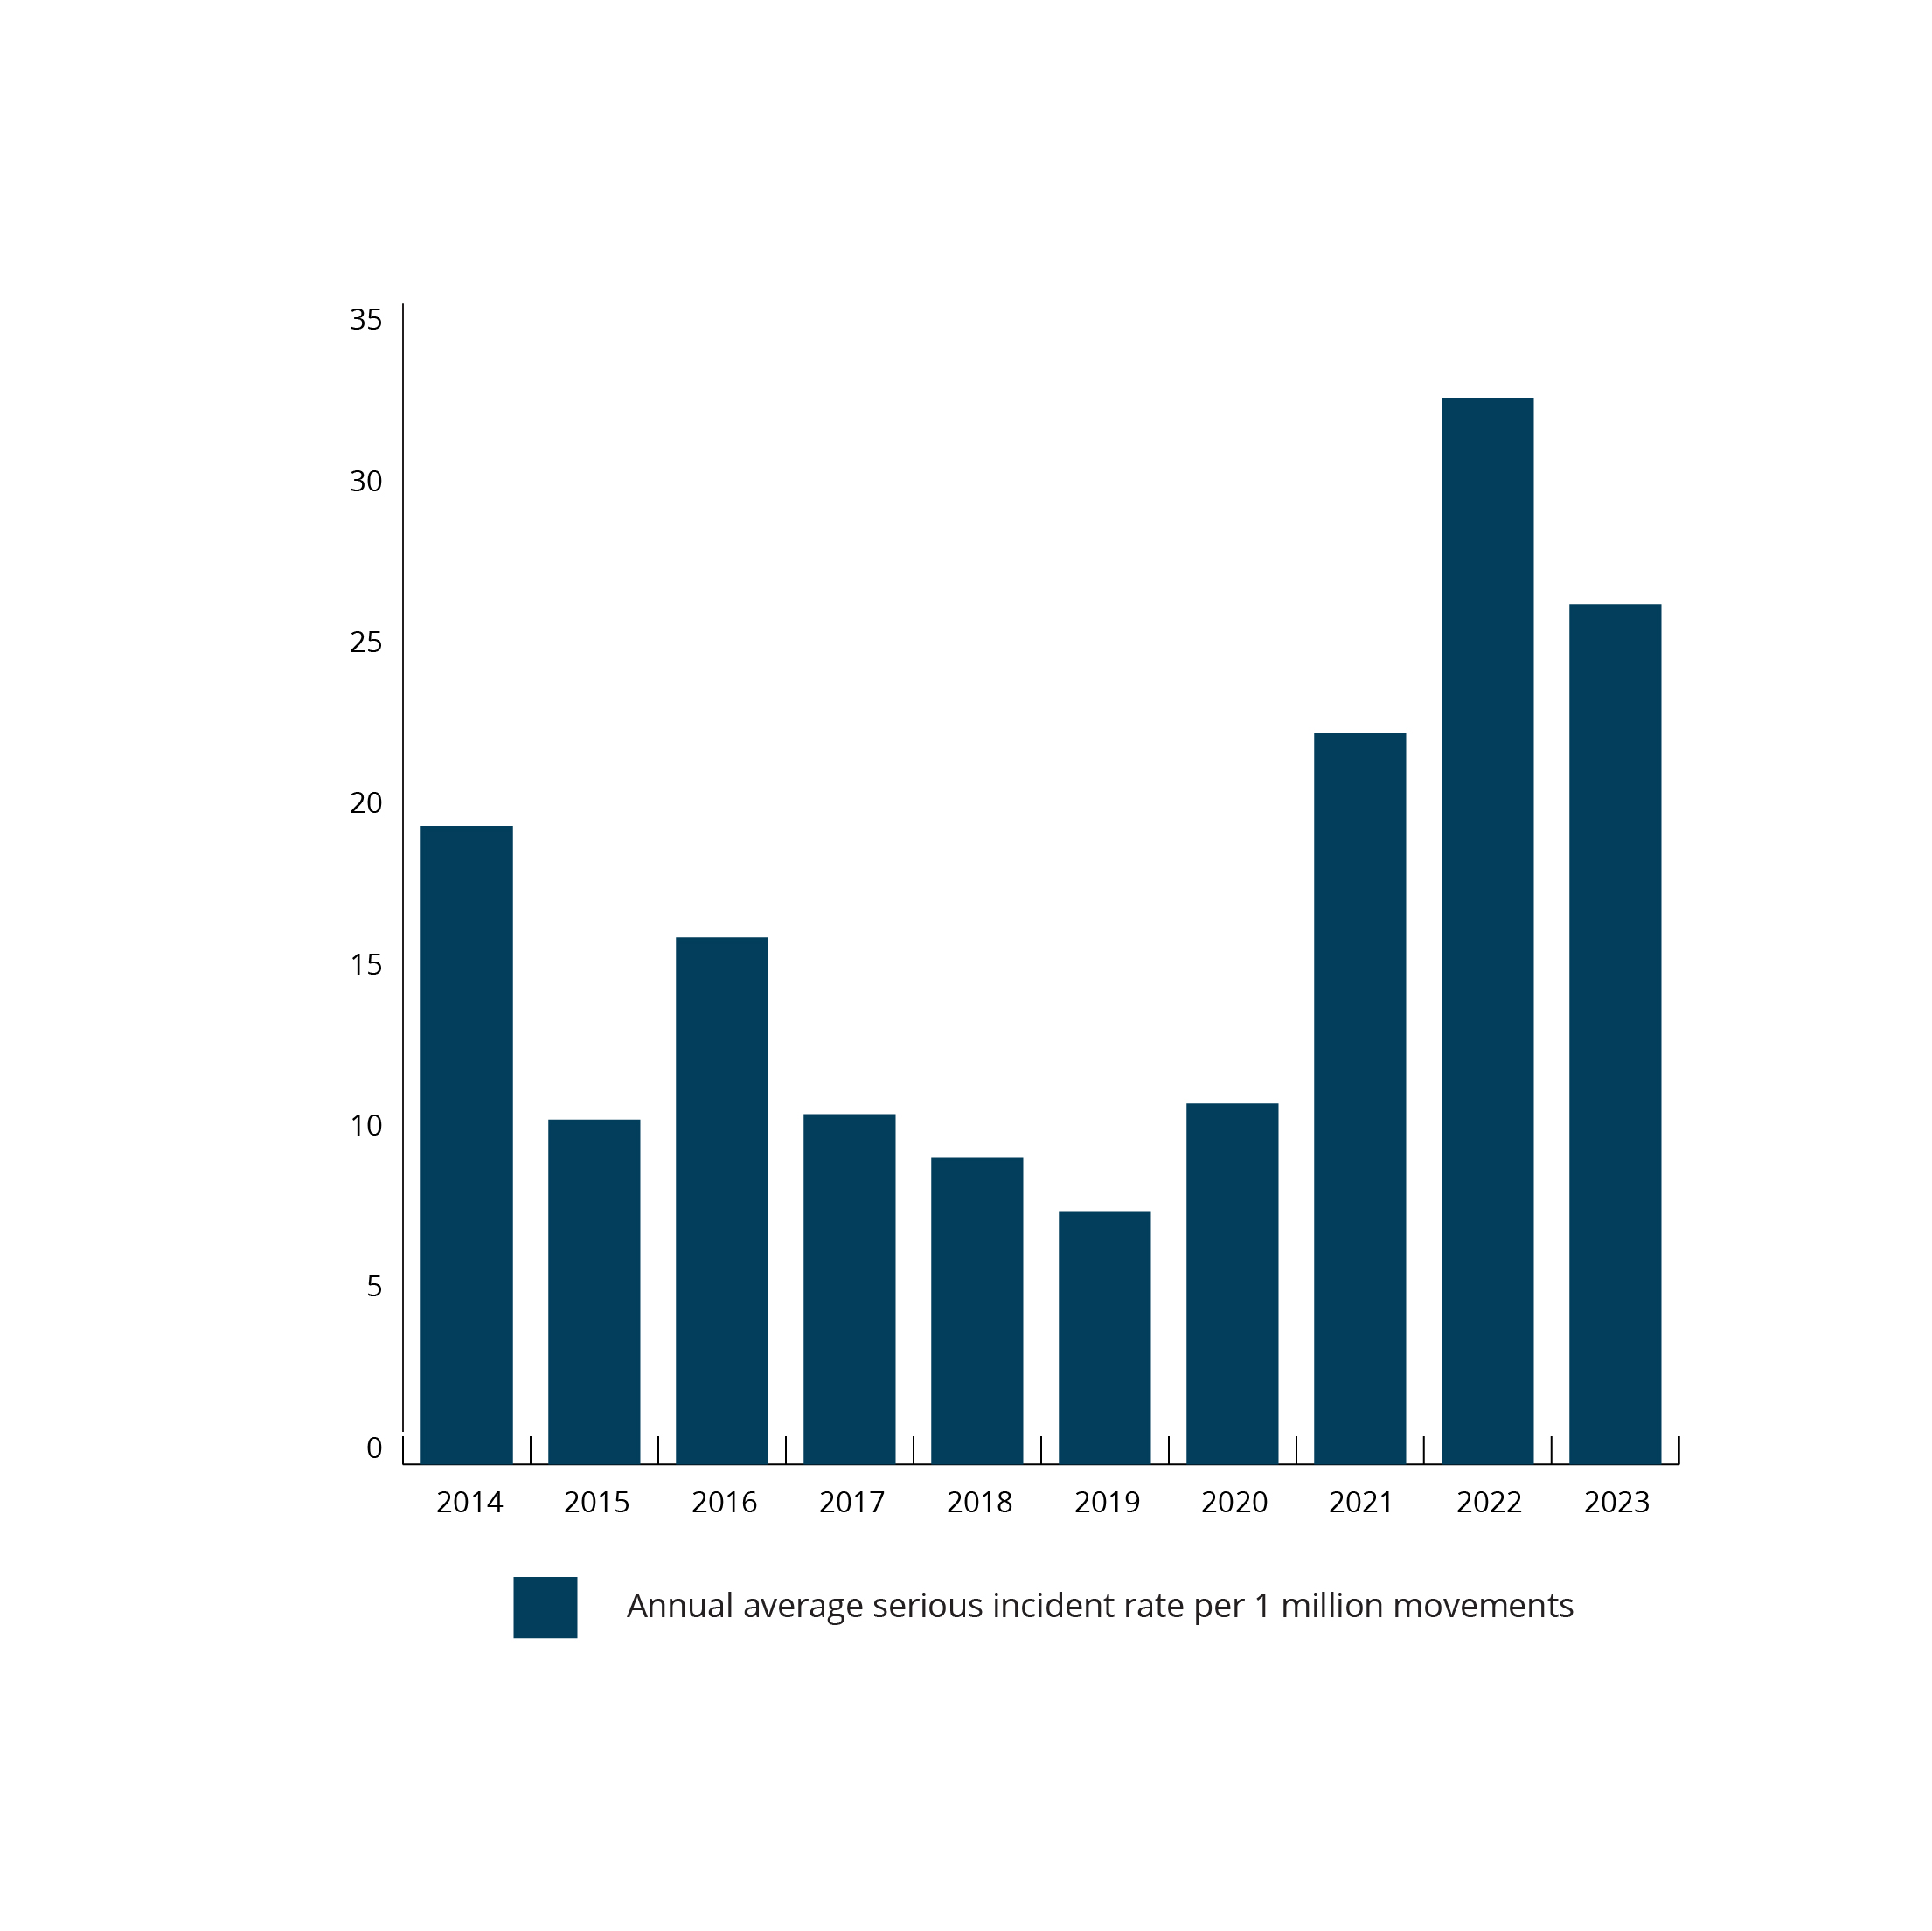
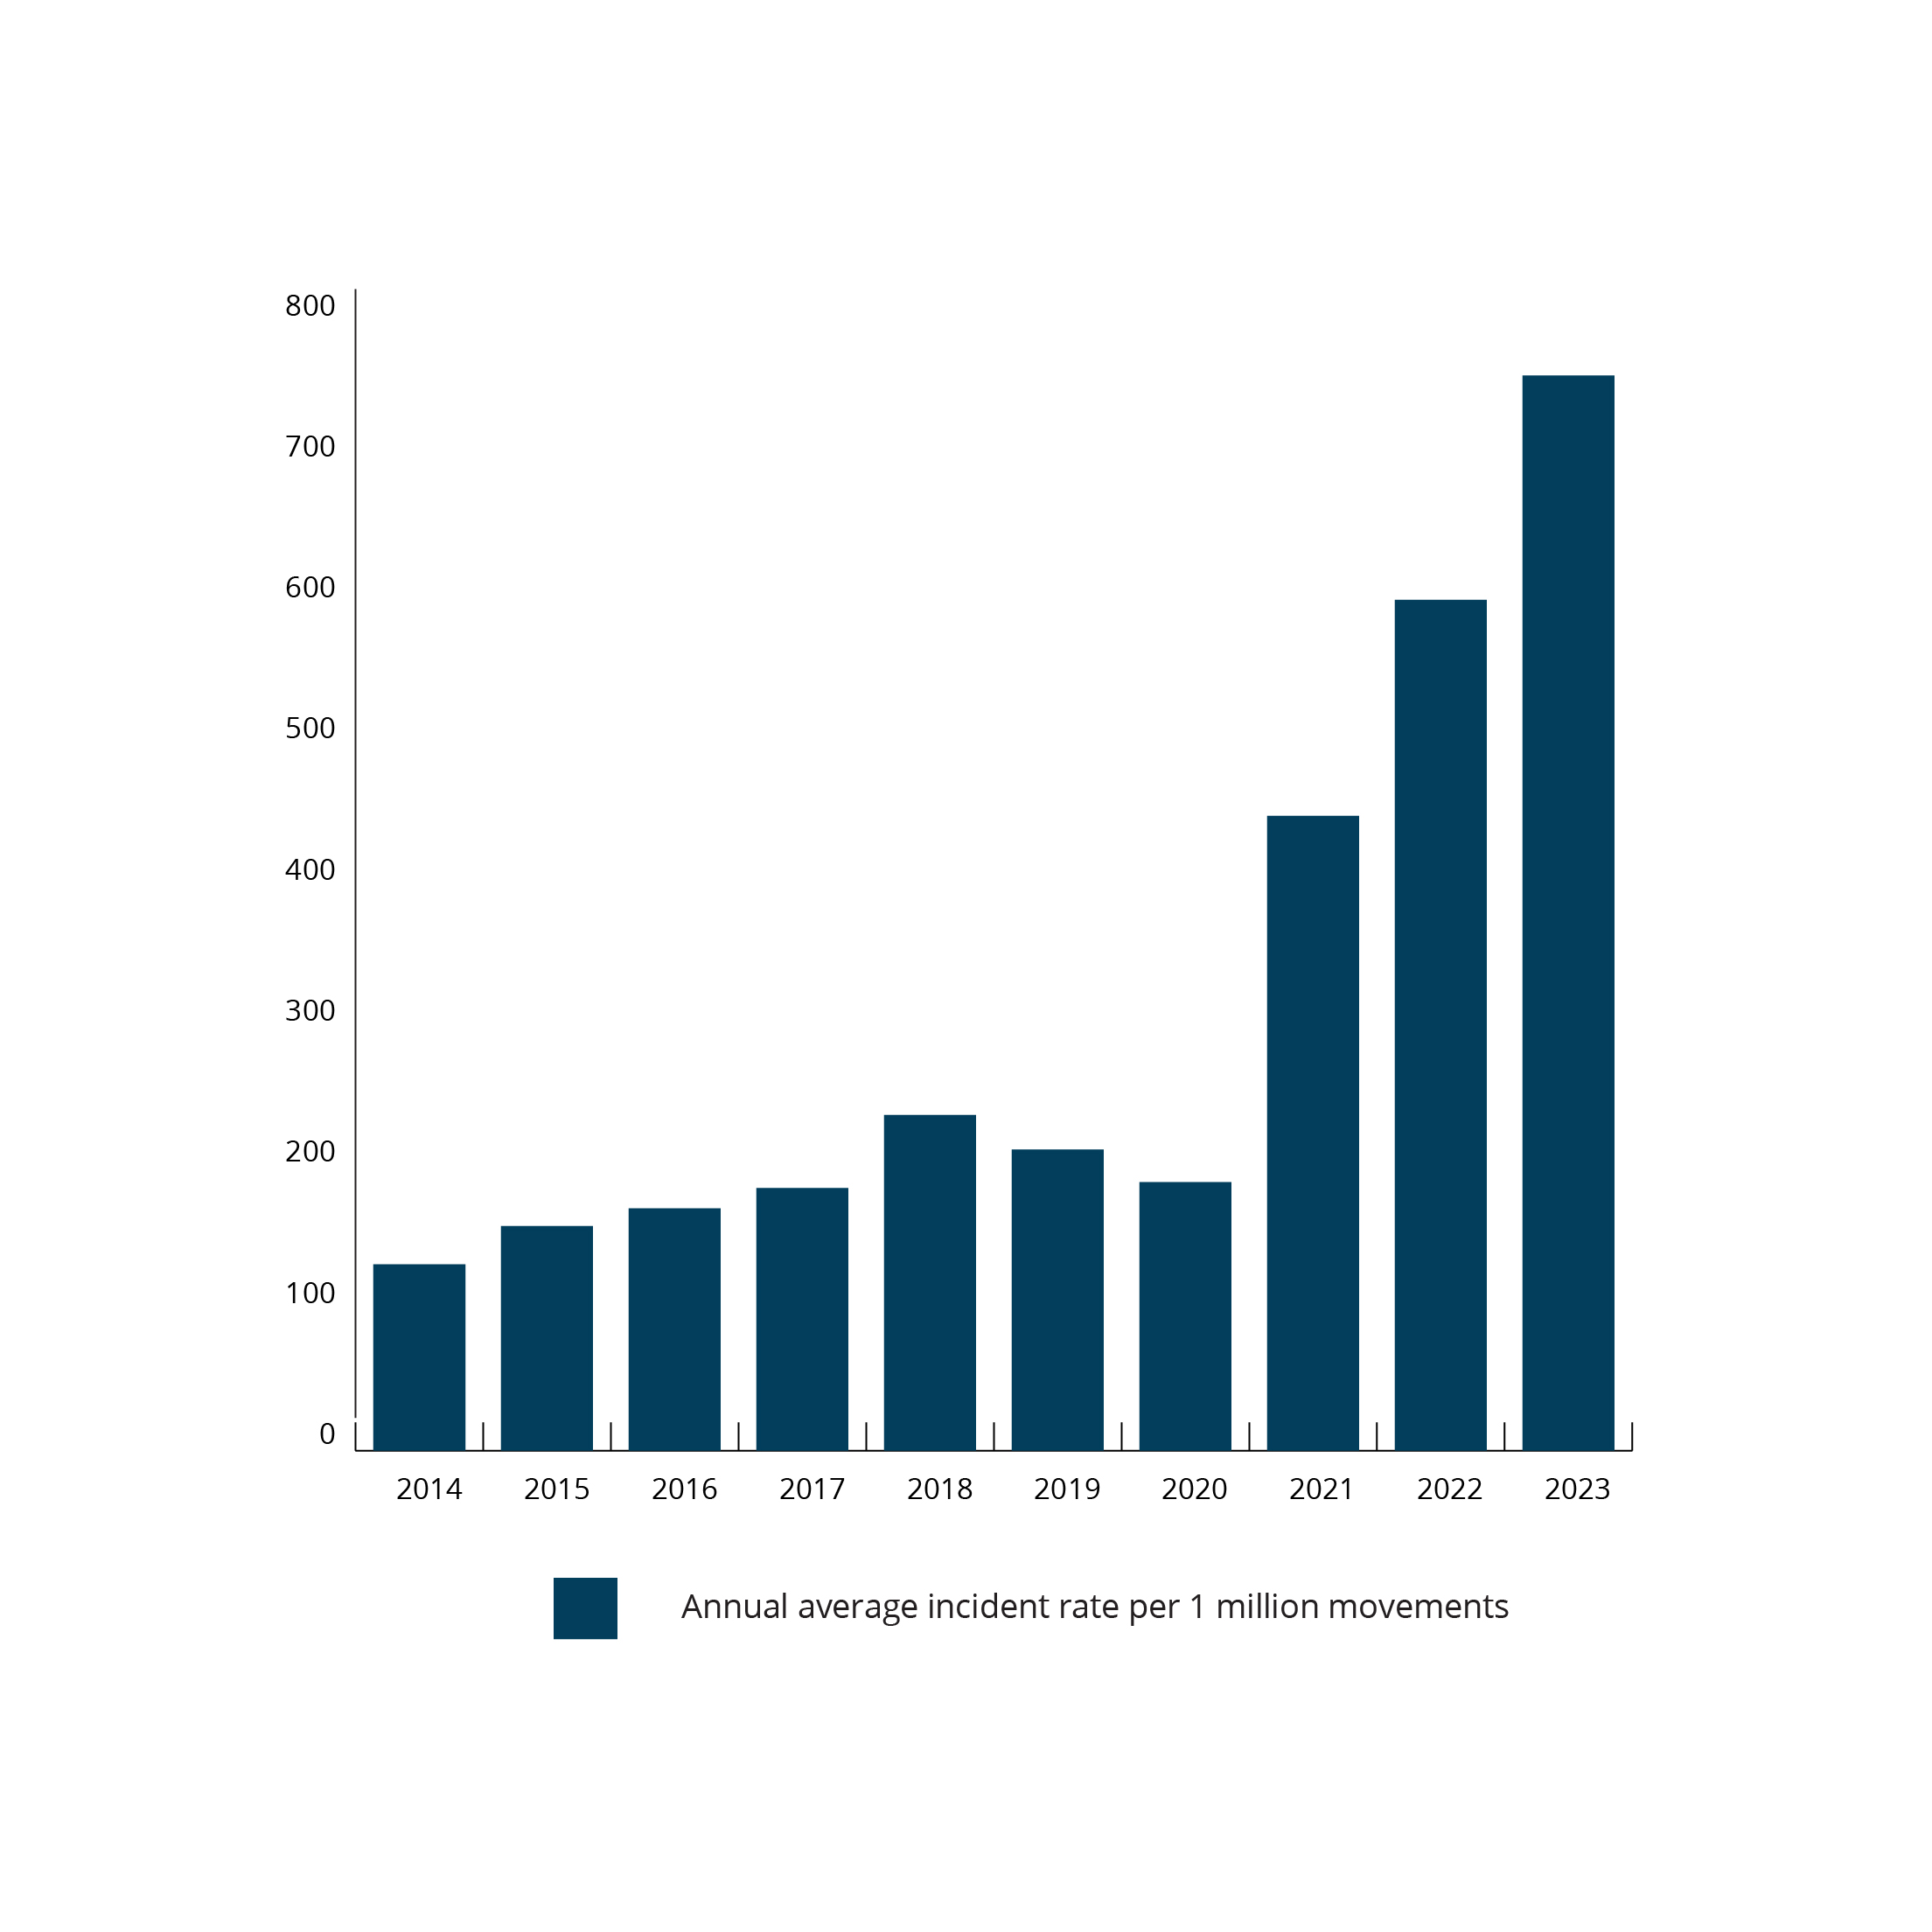
Figure 4 shows the rate of accidents, serious incidents, and incidents per million flying hours from 2014 to 2023 in this sector. Across all 3 occurrence types an increasing trend is clear as shown in Figure 5.
| Rates per 1 million movements | All Operations in 300 Class G |
|---|---|
| Accidents | 4.4 |
| Serious Incidents | 16.9 |
| Incidents | 307.2 |
| Total Movements in 10 years (2014 to 2023) | 7,472,977 |
Enlarge image
Source: BITRE, ATSB Occurrence Database