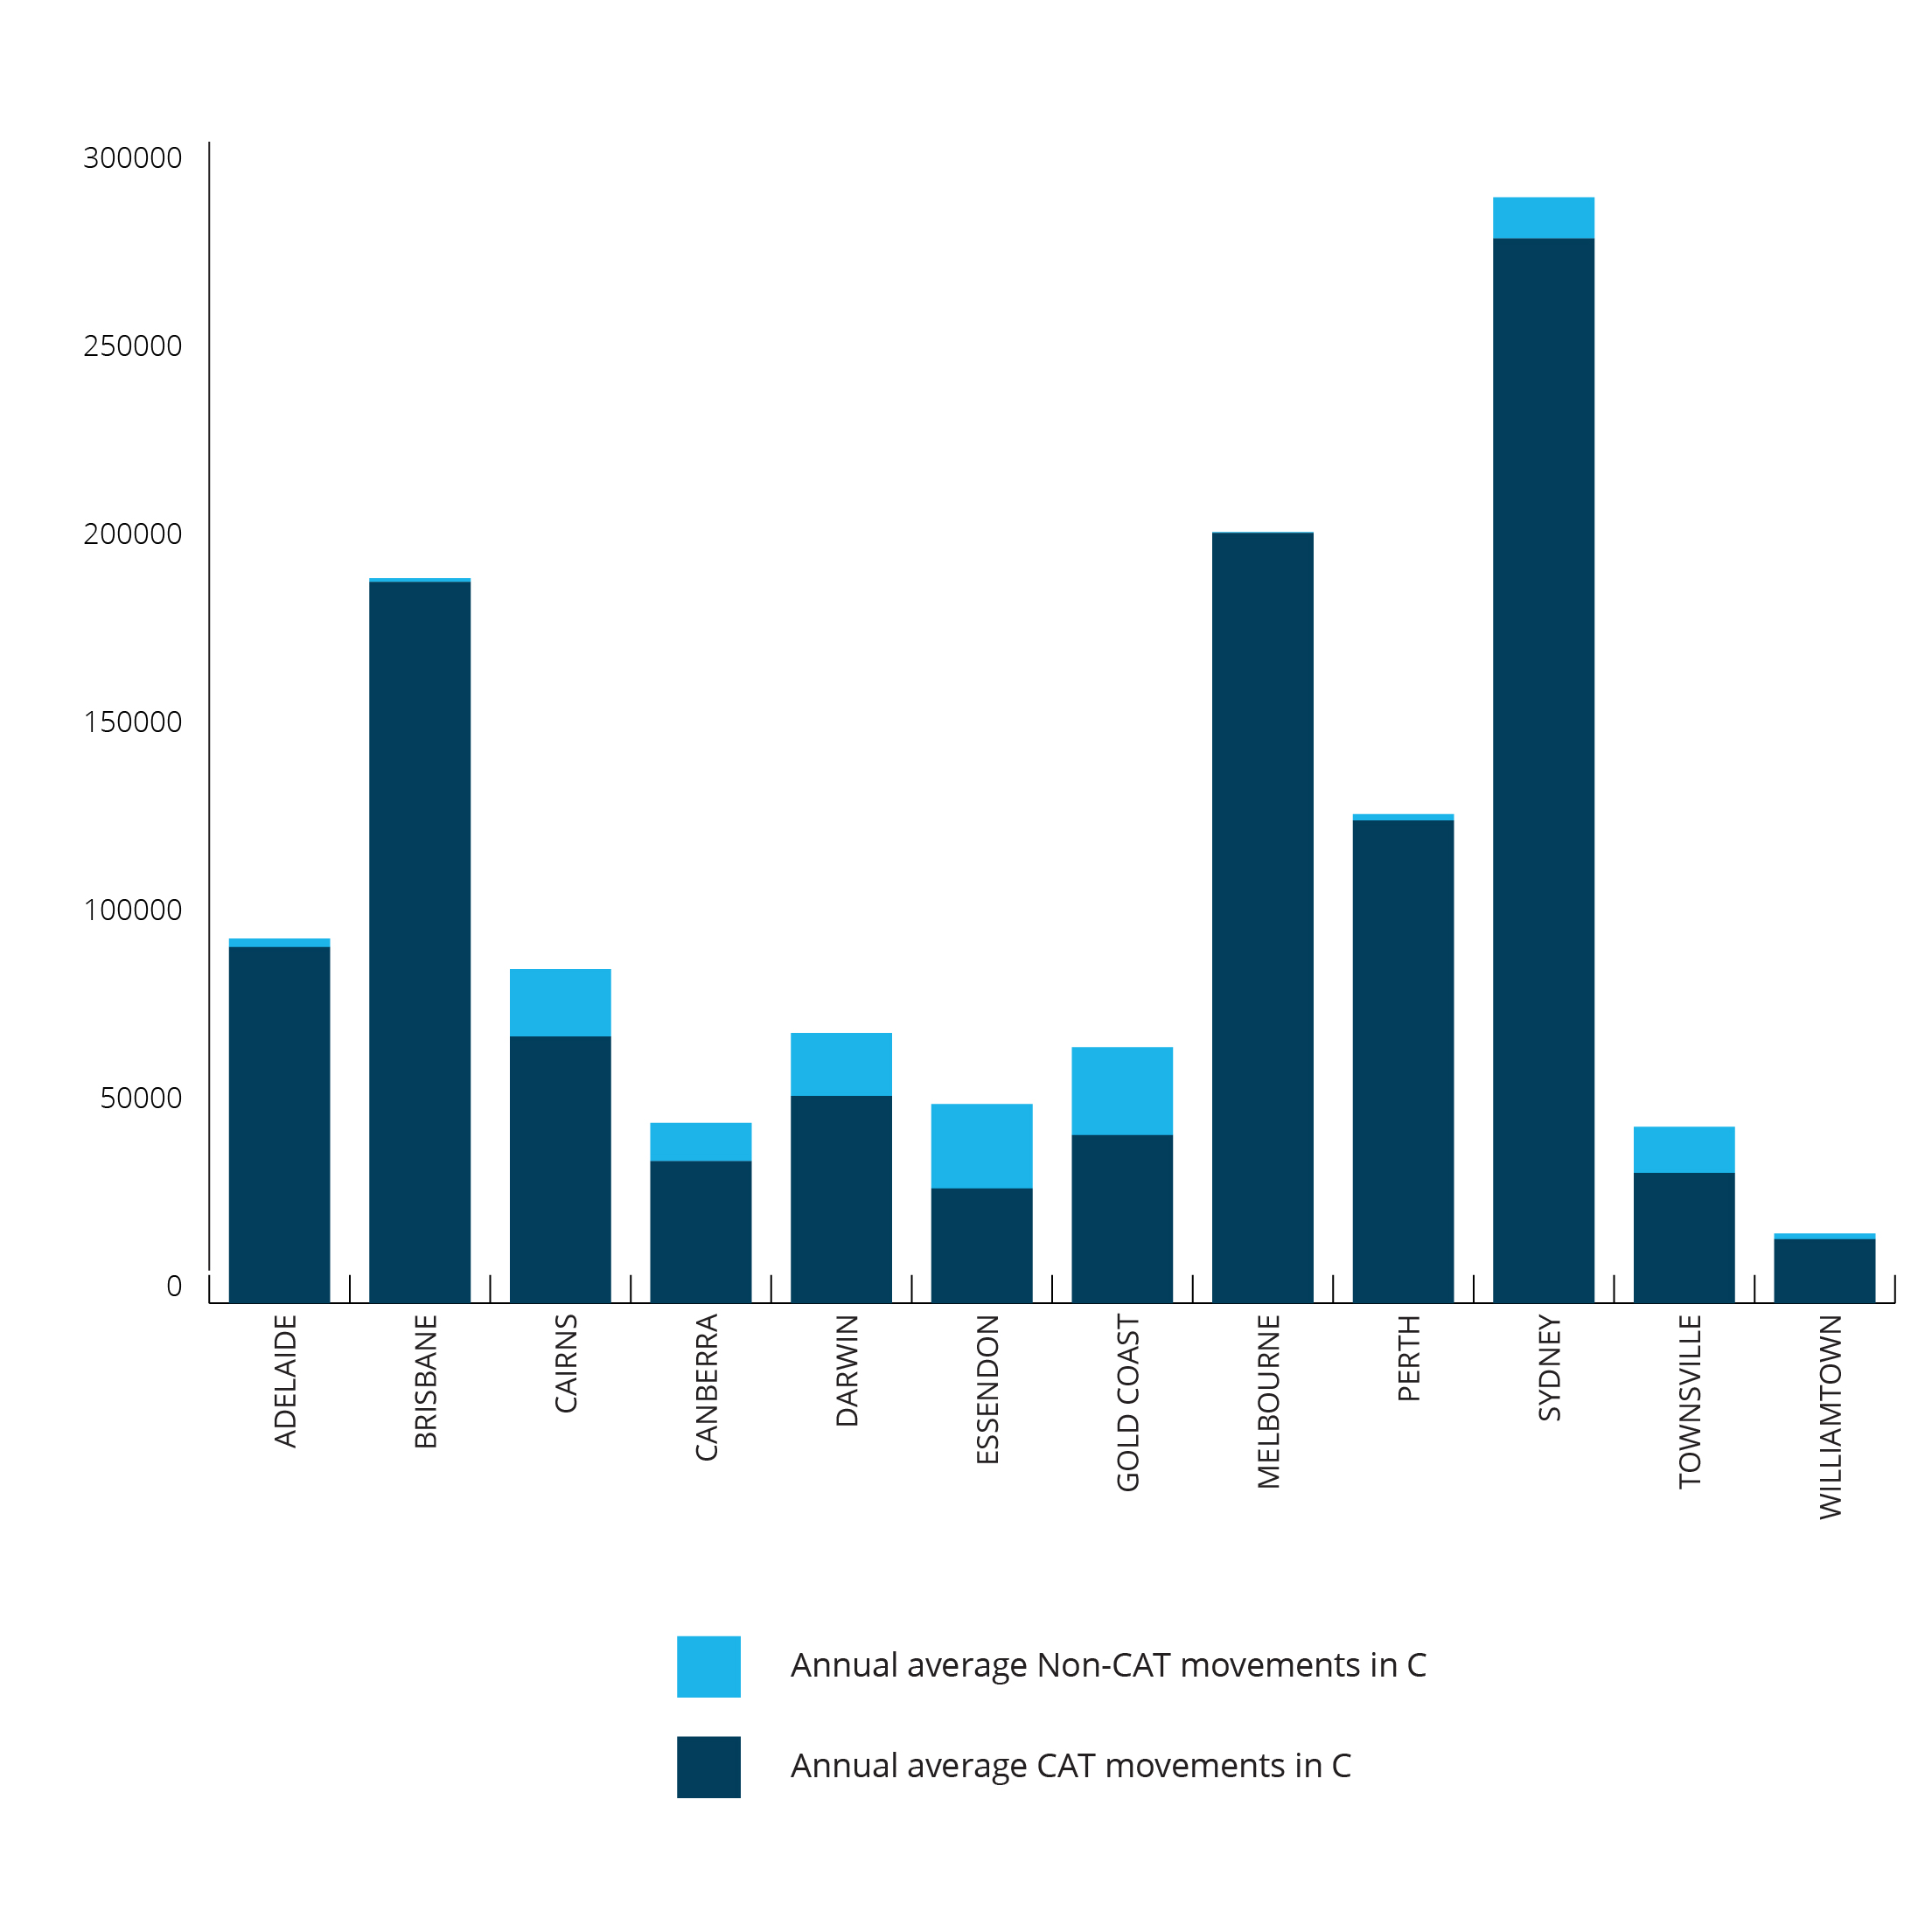
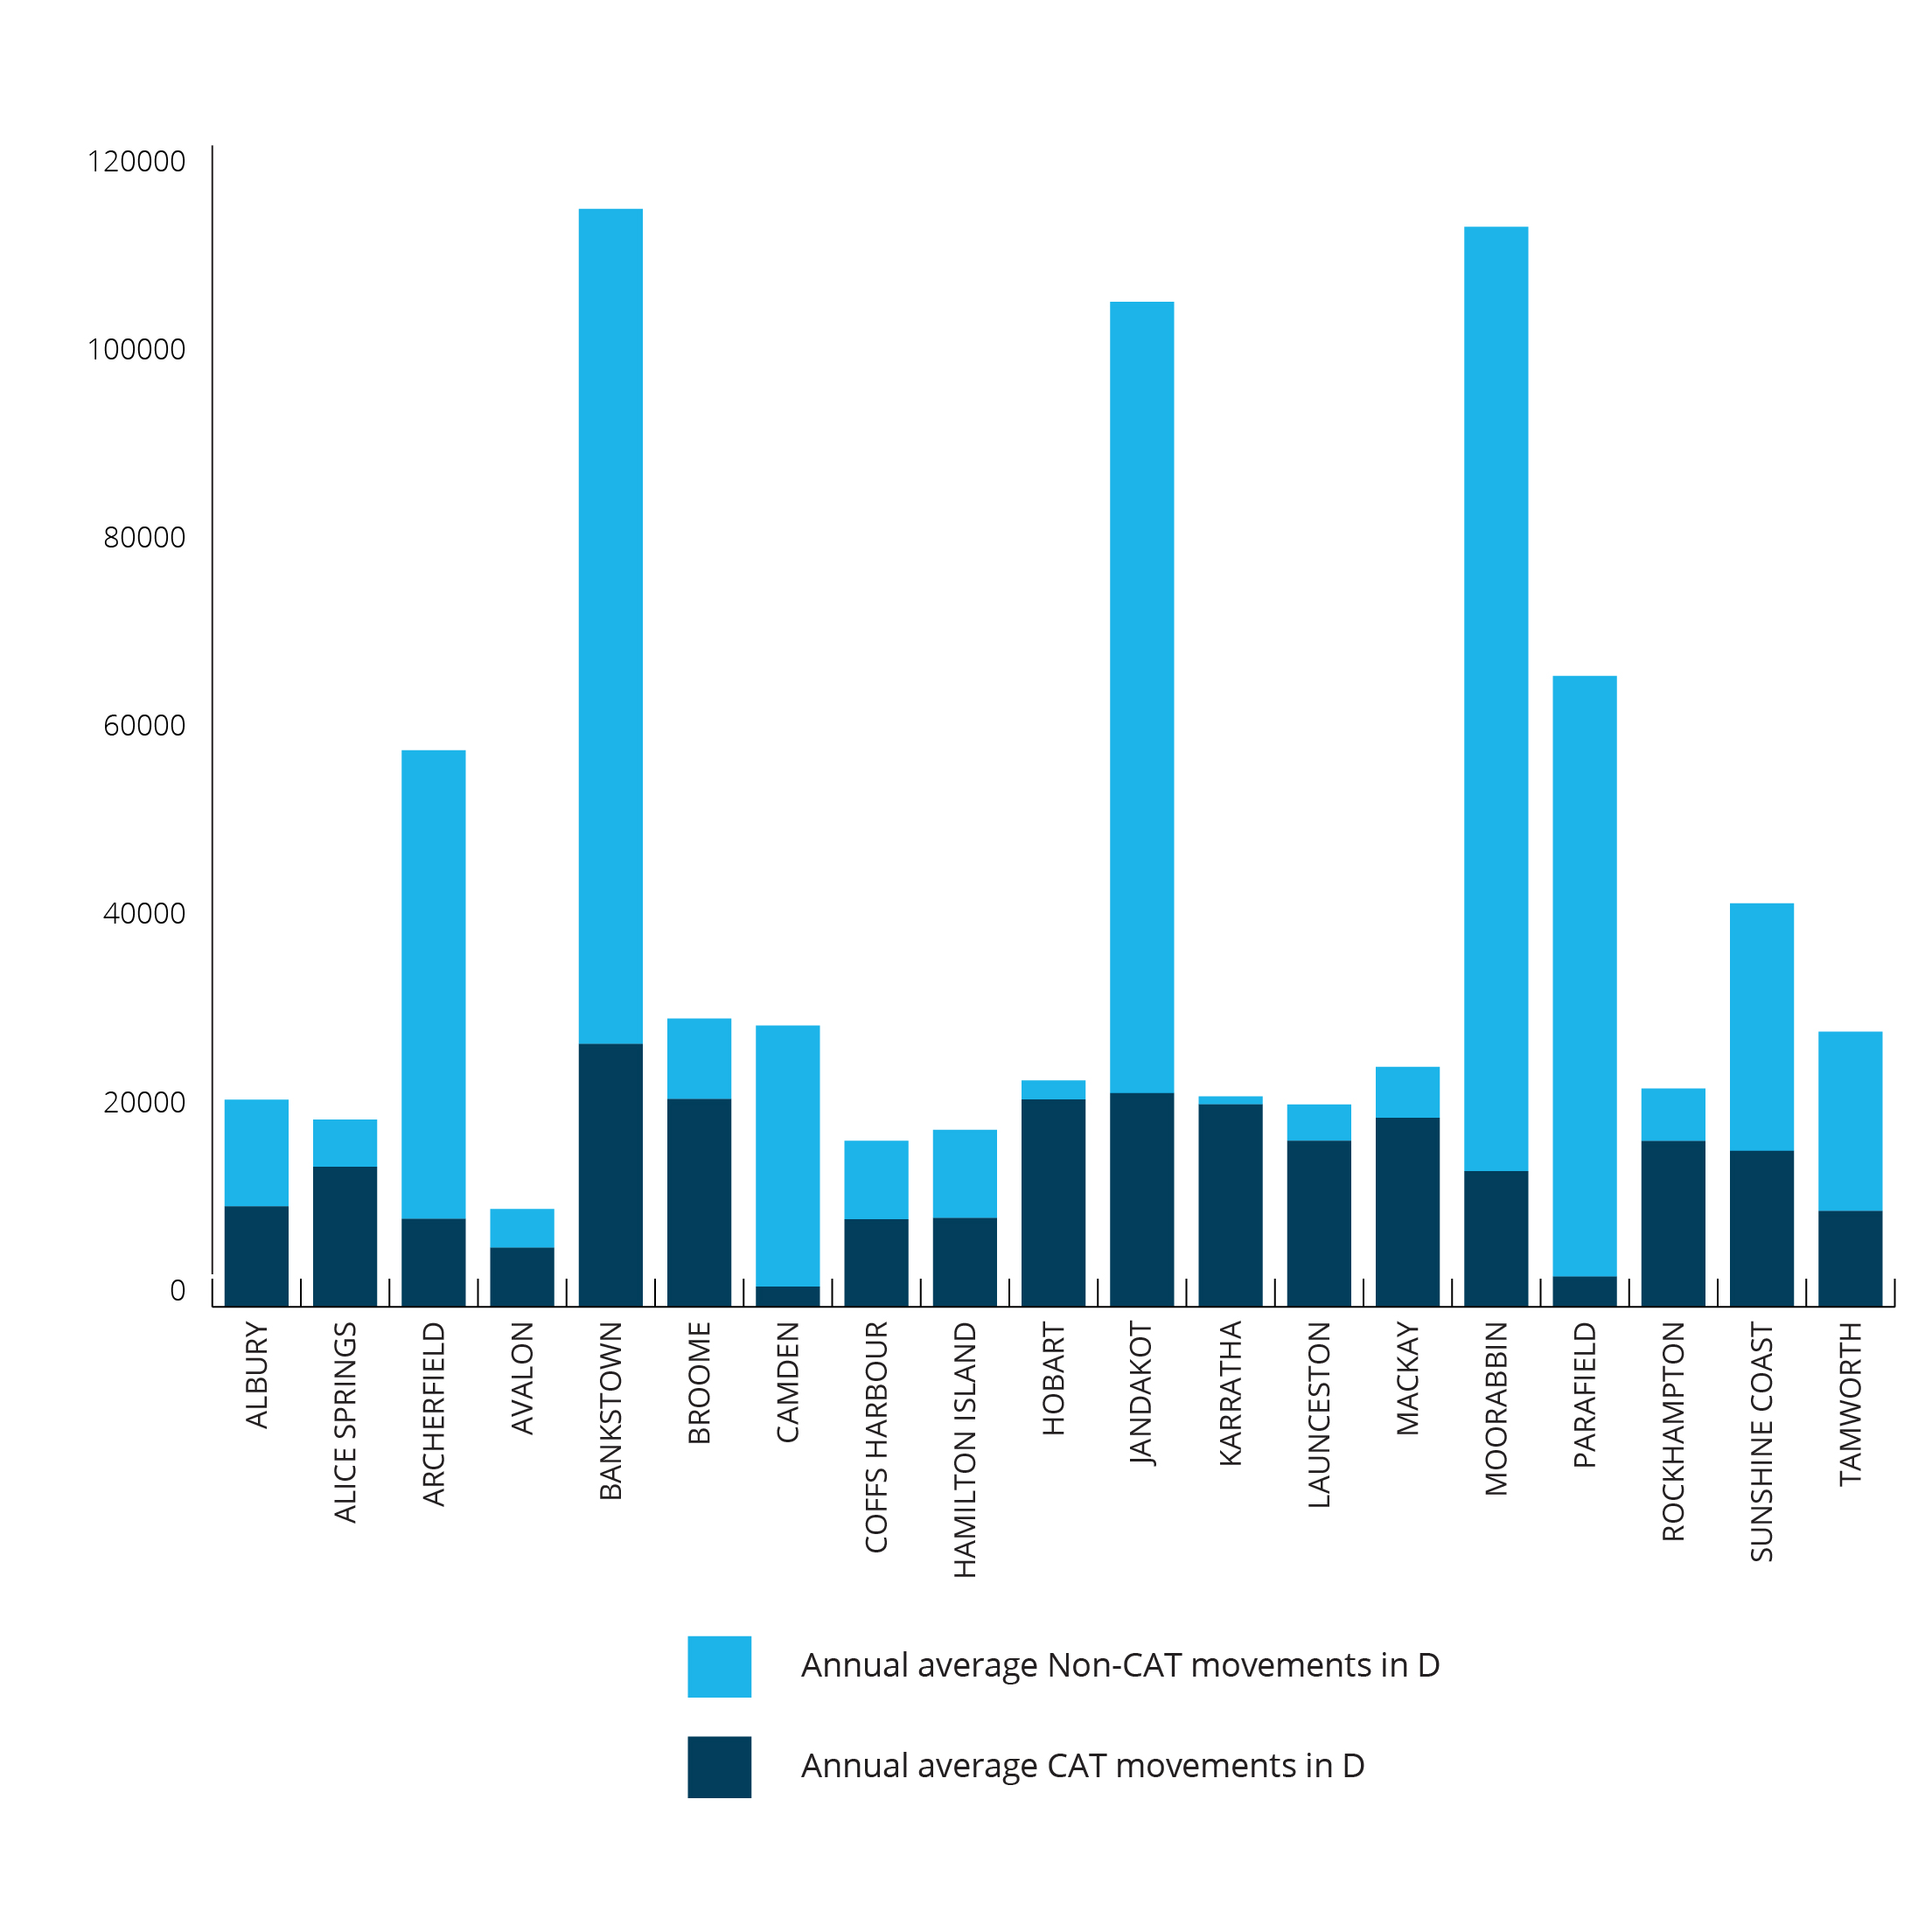
We separated the aircraft movements at controlled aerodromes into commercial air transport (CAT) and non-commercial air transport (non-CAT) from 2014 to 2023. CAT counts for 91% of movements at Class C aerodromes. At Class D aerodromes this average reduced to 35%.
| Aerodromes | CAT Movements | Non-CAT Movements | Total Movements | % of CAT |
|---|---|---|---|---|
| Class C (12) | 1,193,048 | 120,489 | 1,313,537 | 90.8% |
| Class D (19) | 278,337 | 524,607 | 802,944 | 34.7% |
| Total (31) | 1,471,384 | 645,096 | 2,116,481 | 69.5% |
For Class D Aerodromes (Figure 2) most of the annual aircraft movements is with non-commercial air transport (65%) with only 35% is commercial air transport.