Between 2014 and 2023, there were 445 Agricultural flying occurrences in Australia reported to the ATSB.
There were 71 accidents with 7 fatal accidents.
| Occurrence category | Mustering | Spreading/spraying | Other agricultural | Total |
|---|---|---|---|---|
| Fatal accidents | 7 | 9 | 1 | 17 |
| Total accidents | 71 | 92 | 12 | 175 |
| Serious Incidents | 9 | 185 | 1 | 195 |
| Incidents | 10 | 59 | 6 | 75 |
| Total | 90 | 336 | 19 | 445 |
Accidents per million flying hours
We analysed ATSB occurrences rates for agricultural flying.
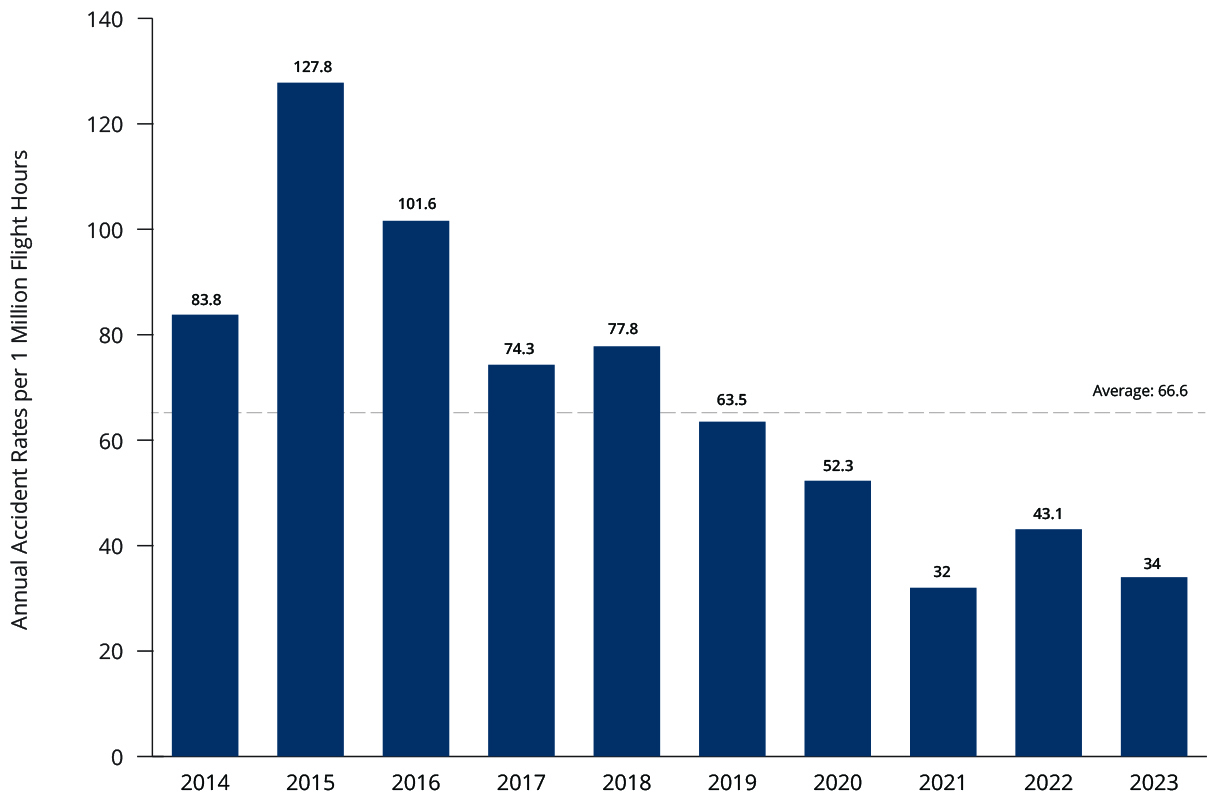
Table 2 shows the rate of accidents, serious incidents, and incidents per million flying hours from 2014 to 2023 in this sector. A decreasing trend is clear for accidents as shown in Figure 2.
Figure 2: ATSB accident rate (per 1 million movements) for all operations from agricultural flying (2014 to 2023). (We estimated the 2023 flight hours by the average of 2014 to 2022.)
| Rates / 1 Million Hours | Mustering | Spreading/Spraying | Other Agricultural | All Agricultural |
|---|---|---|---|---|
| Fatal Accident Rate | 4.7 | 9.8 | 4.8 | 6.5 |
| Total Accident Rate | 47.4 | 61.4 | 8.0 | 66.6 |
| Serious Incident Rate | 9.8 | 201.4 | 1.1 | 74.3 |
| Incident Rate | 47.7 | 281.4 | 28.6 | 28.6 |
| Total 10Y flight hours | 1,497,700 | 918,400 | 209,670 | 2,625,770 |
| Average annual hours | 149,770 | 91,840 | 20,967 | 262,577 |